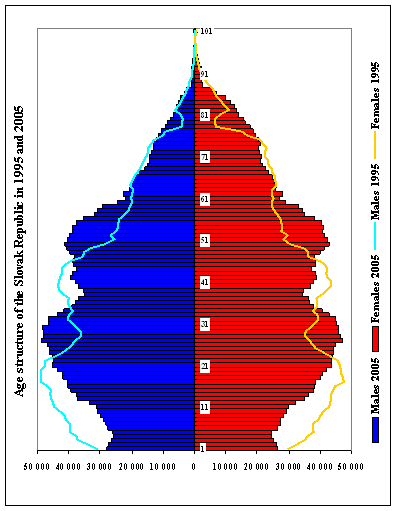
The age structure of population is considered as a basic demographic feature of each population. The results of demographic processes from the past are reflected in the age structure of population; at the same time, it is the basis for the future demographic development. When having a look at the age structure of population of the SR we can see two basic characteristic features - irregularity and ageing.
The irregularity of the age structure of our population is the result of population development in the past. Under the relatively stable (although not favorable) mortality development in Slovakia, it was mainly the uneven development of natality that to a decisive extent caused the mentioned unevenness in the age structure.
Aside the uneven age's structure also another characteristic feature of the population development, being the ageing, is still more and more appearing. The demographic ageing is going on in all advanced countries of the world. According to the achieved level of ageing, there are significant differences between particular countries that are the result of general demographic relations as well as of the specific differences in the demographic development. Although the ageing of population is not so ongoing in Slovakia as in West and North European countries, the changes in age structure are very well visible also in our population.
The first symptoms of population ageing can be seen in Slovakia in the beginning of 60s. All age structure characteristics witness the ageing of the Slovak population. The essential acceleration of ageing in Slovakia will occur after 2010 when the powerful post-war age groups will reach the pension age and, on the contrary, the weak age groups being born in the first half of 90s will enter the age of the highest fertility.
During the recent time period, the changes at the level of main age groups are more visible, what confirms the speeding up of the process of ageing. The share of children aged until 15 years in the population lingeringly exceeded 25 %, even in 1990 this group of population represented exactly the one fourth of population. In 1999 its share got below the level of 20 % and in 2005 it reached lowest value of 16.6 % until now (during 18 years a decrease by more than 34 %). All other main groups recorded, as compared to 1990, an increase of their share, although both the reproductive and older post-reproductive population groups increased their share in population only minimally. The share of population aged 45-64 increased during the recent time period (1990 - 2005) to the greatest extent by 35 %. Population aged 15-44 is however declining since 1998 (a fall by 0.6 % or 16.1 thousand persons during 1998-2005), is to be lingeringly considered as the most numerous group. Thus, currently only the shares of the post-reproductive population groups are increasing. Changes, which are taking place in the age structure of the population of the SR and which can be observed also at the level of main age groups, are marked as population ageing. It appears by the increasing of the mean age of population as well as by the increase of values of ageing indicators.

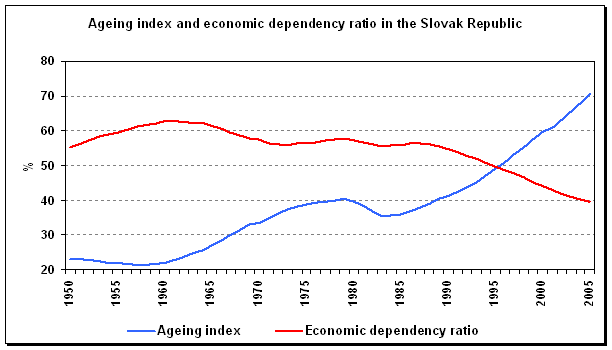
During 90s the demographic ageing of the Slovak population deepened. The number of older people in population increased (absolute ageing), as well as their share (relative ageing). The ageing of population was reflected in all indicators, by which it is possible to measure this phenomenon. Population started to age very remarkably mainly from the bottom part of the age pyramid due to still lower numbers of births, but the ageing appeared also from the top of the age pyramid, what is conditioned by the fact that still more people achieve the higher age. The demographic ageing of the Slovak population is documented also by the growth of mean values. The mean age in 2005 reached the level of 37.4 years what is historically the highest value in Slovakia. As compared to 1995, the Slovak population "has become older" by 2.87 years (increase by 8.3 %). Even better is the population ageing expressed by the ageing index. Currently more 70 persons aged 65 and over fall per 100 persons aged until 15 years. Due to the development at youngest and oldest age groups (accumulation of the effect of the low fertility and the prolongation of human life), the increase of ageing index is extremely dynamic. In comparison with 1995, the ageing index increased by 44 %.
In 2005, approximately 23 people at the pre-reproductive age (0 - 14 years) and 16 people at the post-reproductive age (65 years and over), thus in total 39 non-productive people fell on 100 productive people. It was the lowest value of economic burden in last decade, which was caused by decreasing numbers of live births burden and by relatively low increase of the older population. The economic dependency ratio by young population represented 58.6 % and economic dependency ratio of old population represented 41.4 % of total economic burden in 2005.